Thursday, 30 June 2022

Google rich results guidelines now prohibits weapons, recreational drugs, tobacco & vaping products and gambling-related products

Google has updated its rich results content guidelines to align better with the overall Google merchant guidelines thus disallowing rich results for products that are widely prohibited or regulated, or that can facilitate serious harm to self or others.

These include, but are not limited to, weapons, recreational drugs, tobacco & vaping products and gambling-related products.

New rich results guidelines. Google has updated the rich results content guidelines to add this section:

Don’t mark up content that promotes widely prohibited or regulated goods, services, or information that may facilitate serious and/or immediate or long term harm to self or others. This includes content related to firearms & weapons, recreational drugs, tobacco & vaping products and gambling-related products.

Application. Google said this policy applies to all forms of rich result markup, including star ratings, prices, or availability information and more. This can impact products with rich result structured data markup that are widely prohibited or regulated, or that can facilitate serious harm to self or others. “This could include goods like fireworks, recreational drugs, and other products that can pose acute threats of physical harm,” a Google spokesperson told Search Engine Land.

Effective immediately. Google told us this policy goes into affect today, at the time this story has published.

Why we care. If you sell any of these types of products, you will probably want to remove the structured data markup from those pages. If you do not remove the markup, either way, Google will not show rich results for these product categories.

We did ask Google if you will receive some sort of manual action within Google Search Console and Google said it will not issue manual actions, instead Google will simply just remove the rich results for these types of search results. So no manual action will be given but technically the removal of these rich results is the penalty one would receive for violating the rich results content guidelines.

The post Google rich results guidelines now prohibits weapons, recreational drugs, tobacco & vaping products and gambling-related products appeared first on Search Engine Land.


via Search Engine Land https://ift.tt/I50xabr

How to migrate to Google Analytics 4: A step-by-step guide

You’ve likely heard by now that Google is updating Google Analytics from Universal Analytics (also known as GA3 or UA) to a new, upgraded version, Google Analytics 4 (GA4). 

The migration for many of us from GA2 (Classic Analytics) to GA3 (Universal Analytics) was relatively painless 10 years ago.

This migration isn’t quite as simple. 

There are many differences between the current Google Analytics you’re likely using (UA) and the new version of Google Analytics (GA4), and not all of the features of UA are present in GA4. 

Additionally, Google is pressing us to update now. As of July 1, 2023, the free version of Google UA will no longer collect data. 

That means that you need to seriously address your analytics plan as soon as possible to ensure that as of that date that your new GA4 property is tracking correctly and can provide you with accurate year-over-year data.

Here’s how to migrate to Google Analytics 4.

Phase 1: Create your GA4 property and launch it

Of utmost importance is creating your new GA4 properties and launching them immediately. 

Properties won’t be importing historical data from UA, which means that your GA4 property will only start tracking traffic data from the moment you create it and forward. 

So the sooner you create it, the sooner you’ll have data populating in the GA4 property.

Timeline: Ideally, this should be done before July 1, 2022. But if you miss this date goal, just create your GA4 property (or properties) as soon as possible.

To launch the new property, you’ll need to:

  • Create the new GA4 property.
  • Add the new GA4 tracking tag to your site. 

This is most easily accomplished if you use Google Tag Manager. After deployment, check the new property over the next few days to ensure you’re seeing traffic data populating in the property.

Phase 2: Make a list of your key items

New analytics properties do not inherit specific tracking items (e.g., goals, events) from any other properties (including UA properties). 

The following is a list of the most common tracking items I use in Google Analytics. You may have additional ones to add, but these are some common ones you need to add to the list:

  • Events
  • Goals (Conversions)
  • Content Groupings
  • Custom Dimensions/Metrics
  • Referral Exclusions
  • Product Link Connections
  • Audiences

Once you’ve created your list, evaluate what you need to keep, which you can discard, and also perhaps where gaps might exist where you may want to create new tracking items, such as new events, new goals, etc.

Remember that goals are created in each reporting view. Reporting views are not used with GA4, so if you want to preserve all of the goals you currently have in multiple reporting views for the same UA property, then you’ll need to list all of them and recreate them in the GA4 property. 

Like UA reporting views, which limited you to 20 goals per reporting view, GA4 limits you to 30 conversions per property

When you list out your current goals, be sure to note which ones are “non-event” goals (for example, destination-based goals), as you’ll need to make some changes to how you track those going forward.

Phase 3: Begin migrating individual items to GA4

Once you have your list of items to recreate in GA4, the real setup work begins!

Here are the most common items for set up and some tips for setting each one up:

Events

Events in GA4 are similar to UA setup, but you may need to set the tagging up anew for GA4 goals.

Some events you may have manually set up in the past, like scroll depth, are now automatically added for you in GA4.

So first, check the automated goals that are tracking in your GA4 property by looking at the events under Configure in the navigation. No need to recreate events that Google has already created for you!

Like with adding the general GA tracking code to your site, Google Tag Manager is the easiest tool to use for this effort.

Goals (Conversions)

In GA4, goals are now renamed “Conversions”, and all goals are event-based.

When migrating your existing UA goals to GA4, I suggest starting with the event-based goals, as those are more similar to the original goal set up in UA.

Once you’ve set up the events in GA4 and marked them as conversions, start with destination-based goals and engagement goals.

Content Groupings

In UA, content groupings were created in the interface itself. However, in GA4 there is no interface setup – all content groups are created through page tagging.

In some ways, this is a nice change, but it requires a lot of time investment at the onset.

A page can have multiple “gtags” on it, and the simplest way to implement these will likely be Google Tag Manager.

If you wish to implement content groupings in GA4, visit this reference guide from Google.

Custom Dimensions/Metrics

Like with UA, setting up custom dimensions and metrics is a two-step process – it requires set up in both the interface and the code.

Your existing UA custom dimensions and metrics tags may migrate over fine to GA4, but you will still need to set up the dimensions and metrics in the GA4 property interface.

To set up custom dimensions and metrics in the interface, refer to Google’s setup guide.

Referral Exclusions

Referral exclusions still exist in GA4, but they’ve essentially been renamed and moved a few layers down from the top admin navigation levels.

To add referral exclusions, under your GA4 property admin menu, select Data Streams, then your site data stream (your URL), then select More Tagging Settings under the Additional Settings section.

Finally, click Configure Your Domains and enter your domain and any other domains (such as those from third-party apps that integrate with your website, like certain marketing automation tools).

You’ll need to reconnect your Google products’ links to your new GA4 property. Note that it’s OK to have your Google properties connected to multiple GA properties, so you don’t need to remove your existing UA product links to connect GA4 too.

Product Links now appear at the top level of the property admin navigation. Select each of the Google products you use, like Google Ads, and connect your new GA4 property(ies).

Audiences

Google Analytics audiences are helpful for advertising purposes and now also conversion setup in GA4. It’s important to set up your audiences long before July 1, 2023 so that you can update your Google Ads campaigns with comparable, viable audience lists when the UA properties stop tracking. 

To recreate your audiences in GA4, first focus on the audiences in your list in UA (at the property level) and look for those that have Google Analytics as the audience type. Those will need to be recreated in GA4.

However, the terminology and way you create audiences has changed in GA4, so refer to Google’s audience creation guide for assistance.

Ecommerce

Like almost all things in the UA to GA4 migration, ecommerce tracking also won’t magically move from UA to GA4. Google recommends creating a separate set of tags for GA4 ecommerce tracking, even though it is the same as UA.

Here again, Google Tag Manager is likely the easiest and fastest way to implement your ecommerce tagging across the site.

For detailed information for ecommerce migration, visit Google’s GA4 ecommerce migration guide.

Timeline: Because these items will only start tracking when they are created, ideally the tracking items above should be implemented before July 1, 2022. However, if you can’t complete them all before July 1, 2022, just complete them as quickly as you can.

Phase 4: Check your items

Once you’ve launched your tracking items in the new GA4 properties, you’ll need to double-check that they are tracking properly. 

Evaluate your ecommerce, conversions, event tracking and more to ensure they are tracking as expected in the new properties. If not, troubleshoot the issue and fix it as soon as you can.

Phase 5: Determine a date for migrating to GA4 as your single source of truth

Organizations rely on Google Analytics for reporting for many departments, so it’s important that the organization agree to when the new GA4 property(ies) will become the “single source of truth” for data and reporting. 

In best practice, you should likely wait until you have year-over-year data in your GA4 property(ies) prior to changing your single source of truth to GA4 in part because the metrics and tracking in GA4 are completely different than they are in UA, ergo you cannot accurately use UA data from one year and compare to GA4 data in another year.

If you can get your new GA4 implemented prior to July 1, 2022, then you can likely start using it as your single source of truth as of July 1, 2023.

Regardless, if you use the free version of Google Analytics, you’ll be forced to migrate to GA4 as your primary source of truth on July 1, 2023, even if the year-over-year data with UA isn’t comparable.

Phase 6: Archive your UA data

To add insult to injury, Google decided that in addition to forcing us all to migrate to GA4 now that they will also delete all of our historical UA data beginning on January 1, 2024. 

While you do have a bit more time to archive this data, you should plan on archiving in case you need to reference it in the future. 

First, determine what data you regularly need. For example, I often use the source/medium report. 

Then consider the intervals in which you access this data. Typically, I access data on a monthly basis, such as June 1-30. You’ll want to archive your data in a manner that matches these data usage habits.

I personally find the UA interface clunky for archiving purposes. In my example of the source/medium report and pulling monthly data, in the interface, you can only pull two months of data at a time (one as the original month and one as the comparison month), then download the data to CSV. That will take forever! 

Instead, especially if you’re not a developer who knows how to use the Google Analytics API, consider using the Google Analytics Spreadsheet Add-On, which works with Google Sheets. It’s super handy and pulls that data fast! 

Just be sure you don’t run into data sampling issues, and if you do, take smaller reports. 

For example, if I pull 10 years of data from the source/medium report broken down by month, it may be so much data that it forces Google to sample the data. If that’s the case, I would try breaking it down into several report pulls, perhaps one year’s worth of data per report. You can always combine the data into one sheet once it’s pulled.

Timeline: If you are using the free version of UA, you will need to do this between July 1-December 31, 2022. Your data will be deleted on January 1, 2023. If you are using UA 360, you must archive your data before June 30, 2023.

Finally, don’t panic!

I know, it’s all stressful. Hang in there. It’s going to be OK. 

I speak on this subject around the country, and recently someone asked me if there’s anything good about GA4.

The answer is a resounding yes

GA4 is aiming to get us all closer to true ROI and cross-device reporting. 

However, growth and change are difficult. We humans don’t tend to enjoy it. 

But it truly will all be OK. Just prioritize this now, and if you need my help, please reach out. Data is my passion, and I want yours to be accurate! You can reach me at jmiller@marketing-mojo.com.

What you need to know about adopting Google Analytics 4

Want to watch my SMX Advanced session, which explored the differences between GA4 and Universal Google Analytics? You can watch it on-demand.

The post How to migrate to Google Analytics 4: A step-by-step guide appeared first on Search Engine Land.


via Search Engine Land https://ift.tt/lSVNgvn

Google documents how to inject canonical tags using JavaScript

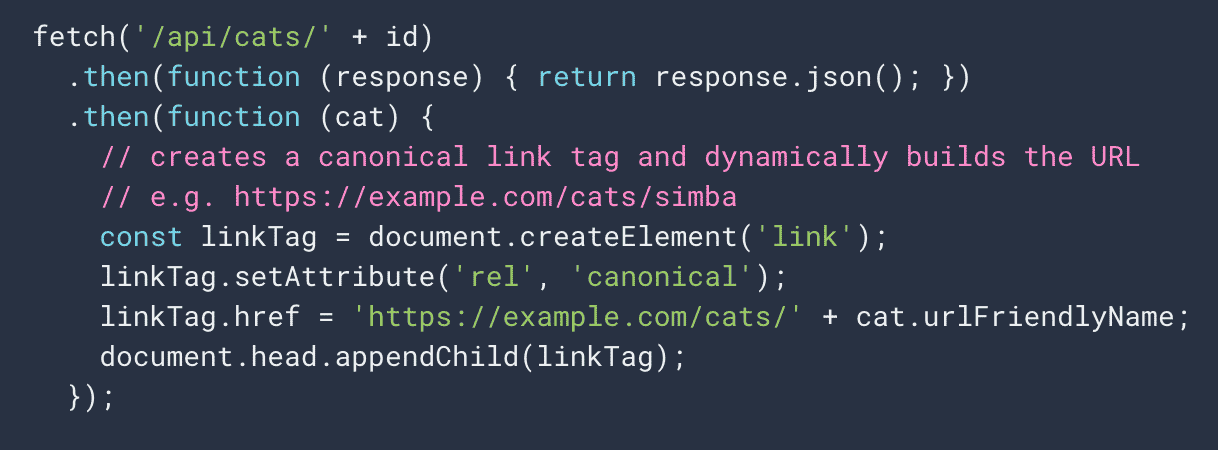
Google has updated its JavaScript SEO help document to add technical details on how to inject canonical link tags using JavaScript. Google added a new section titled “properly inject rel=”canonical” link tag.”
What is new. Here is the new section where Google recommends not to implement your canonical tags using JavaScript, but if you must, Google explains this is the proper way to do so. Google wrote:

While we don’t recommend using JavaScript for this, it is possible to inject a rel=”canonical” link tag with JavaScript. Google Search will pick up the injected canonical URL when rendering the page. Here is an example to inject a rel=”canonical” link tag with JavaScript:

Google added this warning stating “When using JavaScript to inject the rel=”canonical” link tag, make sure that this is the only rel=”canonical” link tag on the page. Incorrect implementations might create multiple rel=”canonical” link tag or change an existing rel=”canonical” link tag. Conflicting or multiple rel=”canonical” link tags may lead to unexpected results.”

Hit or miss. We have seen cases where Google can pick up these canonical tags or other embedded elements, even structured data, using JavaScript. But it can be hit or miss, so it is recommended that if you are going to use JavaScript specifically to inject your canonical tags, follow these directions precisely.

Why we care. Again, if you are injecting canonical tags using JavaScript, Google has finally officially documented the proper way to implement it. So check the documentation over here and make sure your implementation follows Google’s recommendations.

The post Google documents how to inject canonical tags using JavaScript appeared first on Search Engine Land.


via Search Engine Land https://ift.tt/FV0iznI

11 Google Sheets formulas SEOs should know

Sometimes the best SEO tools are free.

Look no further than Google Sheets.

While it’s not great at plotting ranking data (inverting the y-axis is always ugly), there are numerous ways to use Google Sheets for SEO.

Here are 11 of the formulas and tips I find myself using for SEO on an almost daily basis – for keyword management, internationalization, content/URL management and dashboards.


Get the daily newsletter search marketers rely on.

Processing...Please wait.


Google Sheets formulas for keyword management 

  • V LOOKUP
  • CONCATENATE
  • FLATTEN
  • LOWER

=VLOOKUP(text,[range to search],[column number to return],[true/false]) 

V LOOKUP (documentation)

VLOOKUP, which stands for “vertical lookup”, is arguably one of the very first Google Sheet formulas for SEO anyone learns when getting into the game.

VLOOKUP allows you to essentially combine two data sets on common values, an almost lowbrow JOIN in SQL if you will.

I generally use this formula to enrich information about keyword sets by adding search volume, PPC data or adding downstream metrics like signups. 

The end directive true/false specifies how exact you want the match to be, TRUE means not an exact match, and FALSE means exact matches only.

Tip: LOCK the range you’re searching against using $ ($E$3:$E$5 in the below example) so you can drag and carry the same formula across many rows.

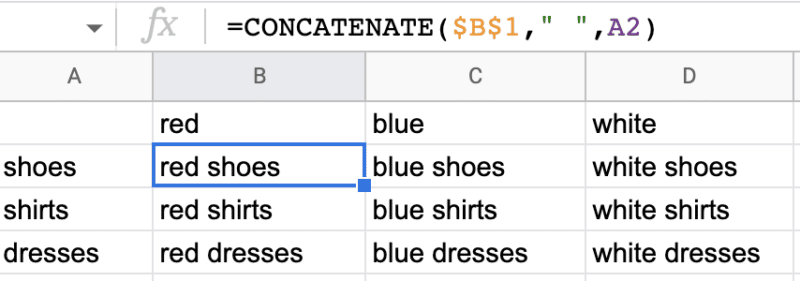
=CONCATENATE(A1,A2,A3) 

CONCATENATE (documentation)

  • =CONCATENATE(A1,A2,A3) you have the option to concatenate columns
  • =CONCATENATE(A1,” I’m additional text”) or literal words and characters

Concatenate is one of the most commonly used Google Sheet formulas in SEO, and for good reason.

It can serve a variety of use cases, including creating keyword lists (concatenating two+ variables together), creating URL strings, or even bulk templatizing metadata.

As the name suggests, you can use it to simply string any amount of values together.

Just remember: if you need a space between keywords, a literal space “ “ must be added.

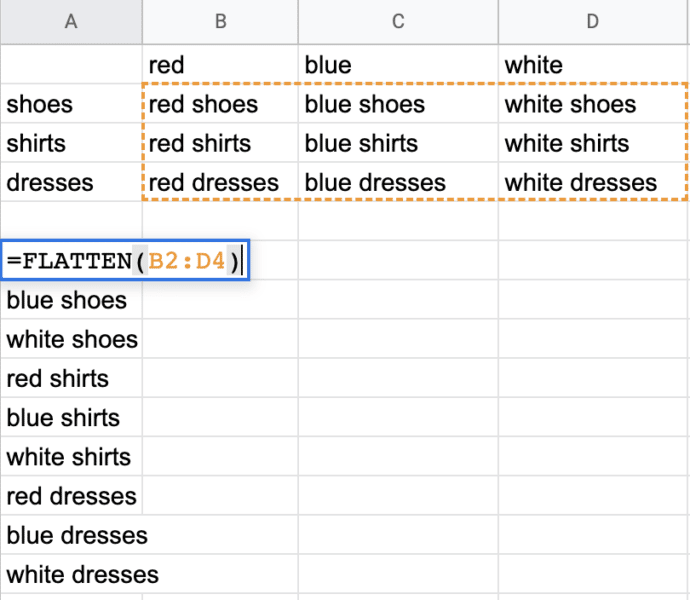
=FLATTEN(range1, [range2, …]) 

FLATTEN (documentation)

  • =FLATTEN(A:D) would compress all ranges in A – D in to one column

There’s a reason FLATTEN is coming after concatenate. After you’ve concatenated several thousands of keywords and a couple of hundred dollars away, you generally need to upload the keywords into your rank tracking tool’s UI or via a CSV bulk upload.

It can be tedious when you have a 20×20 block of keywords to get them into a single column so you can upload all your keywords in one go.

With FLATTEN, you essentially select the range of data you want and the output is all of your keywords in one column to make copy-pasting a dream!

=LOWER(text) 

LOWER (documentation)

This one’s pretty simple – but it can be helpful to LOWERcase all the of the keywords you’re managing (especially if you use a service provider that charges for things like duplicates) or if you’re in a case-sensitive environment like SQL.

LOWER is admittedly one of the simplest Google Sheets formulas for SEO.

The opposite (UPPER) also works, should you feel like auto-capping everything. 

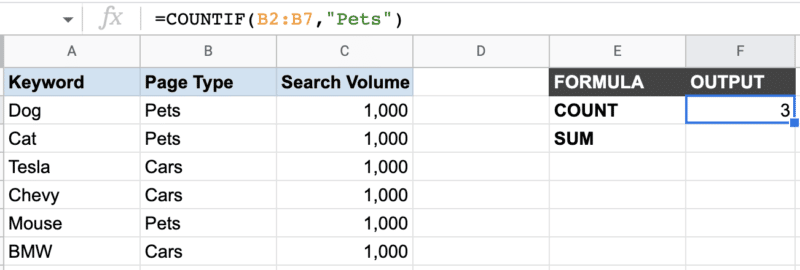
=COUNTIF(range,”[text or function]”) 

COUNTIF (documentation)

COUNTIF lets you count, with accuracy, any literal text you want to match or even some numerical values that meet conditional rules.

It’s particularly useful when grouping together pages, managing an upcoming content calendar or sorting keywords on common dimensions like the page type or product they support.

It can also be used with conditions to match values, such as ones that have CPCs > $10.00 or that have a search volume > 100 searches a month. 

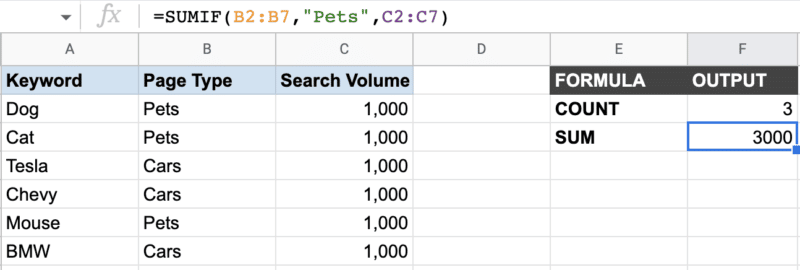
=SUMIF([range to search],”[condition to match]”,[range to return]) 

SUMIF (documentation)

SUMIF is similar to COUNTIF, but is helpful if you’re trying to add up an additional metric associated with the group of interest, like summing up total keyword volume opportunities by themes or search volume by page type. 

Google Sheets formulas for internationalization

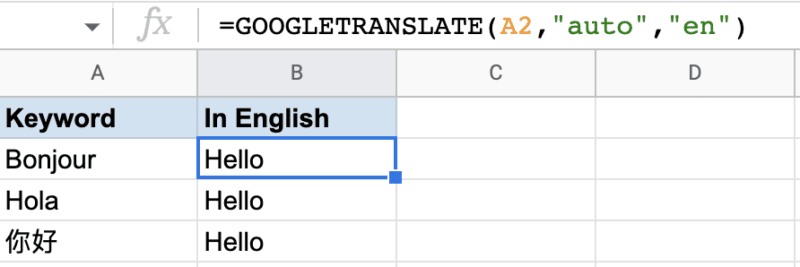
=GOOGLETRANSLATE(text, [“source_language” or “auto”, “target_language”])

GOOGLE TRANSLATE (documentation)

  • source_language = two-letter language code of the source language (or “auto” for Google to guess)
  • target_language = two-letter* language code for your target language, like ES for Spanish

Ahh, one of my favorite and most loved Google Sheets hacks.

Rather than go back and forth to the Google Translate UI and risk carpal tunnel, you can bulk translate lists of keywords in seconds into one, or even multiple languages.

You even have the option to auto-select the origin language by changing source_language to “auto” to let G sheets choose for you (which usually works, usually).

Google doesn’t support translating into all “flavors” of languages (e.g., Canadian French), but supports languages like pt-pt and pt-br, as well as Chinese languages like zh-tw and zh-cn.

Google Sheets formulas for content/URL management

=SPLIT(text,[delimiter wrapped in “”])

SPLIT  (documentation)

Many times when you’re doing an analysis you might be working with data that is not in the required format you need.

There might be extraneous information that is separated (delimited) by things like commas (addresses), phone numbers (parenthesis and hyphens) and more.

While there’s a “split text to columns function” in the toolbar under “Data”, you can also split text that is delimited by a specific character, word or even spaces to individual columns with the SPLIT command directly in the sheet so you can quickly trim and tidy your keyword list.

=LEN(text) 

LEN  (documentation)

LEN is a simple Google Sheets formula for SEO you can use to simply count the characters in a line or string.

It can be most helpful when guiding people (both SEOs and non-SEOs) who are writing their own metadata, to stay within a “safe” enough character count so that it will hopefully not get truncated simply due to length.

=REGEXREPLACE(text, “regular_expression”, “replacement”)

REGEXREPLACE  (documentation)

Regexes are a powerful data mining tool when working on large websites.

If you’ve never even heard of regexes, you’ve probably not yet been challenged with an enterprise-level site.

I find myself using REGEXREPLACE most often when I’m cleaning up or trimming URLs in a sheet, where it can be helpful when I only need a path name minus domain or to manage redirects.

Google Sheets formula for dashboards

=SPARKLINE(B3:G3)

SPARKLINE  (documentation)

  • =SPARKLINE(B3:G3,{“charttype”,”line”; “color”,”indigo”; “linewidth”,2}) this version of sparkline is in indigo, with a slightly heavier weight

While BI tools like Tableau and Looker offer additional customizations, Google Sheets can be a cheap way to build simple dashboards.

The command SPARKLINE is capable of leveraging data to create simple visualizations in a Google Sheet.

A good amount of SEO and web data looks great on a time series, and Google Sheets can make it easy.

This is most helpful when you have data that is being actively updated inside of Google Sheets and need to skim 10+ trends quickly in one sheet.

A popular use case is to monitor trends like growth in several countries, campaigns or city-level basis. 

=SPARKLINE(B3:G3,{“charttype”,”line”; “color”,”[color you want]”; “linewidth”,2})

Time series/line charts

Time series is probably the most helpful for visualizing changes to traffic patterns over time and is suitable for monitoring most traffic trends and north star goals.

You can also remove the “line width” command, weight and even color for a quick and easy graph, but I find for time series I always need the line to be a little bolder and the contrasting color helps draw attention to the graph.

Column charts and bar charts
Sparkline even supports column and bar charts! Just change the chart type to column (shown below) or bar.

In more advanced use cases, most of the formulas above can be manipulated to have enhanced outputs, like automated conditional formatting or fun Unicode emoticon responses instead of nulls.

No matter how advanced you make them, using these formulas inside of Google Sheets is a great and cheap way to do basic SEO tidying work and keyword research.

The post 11 Google Sheets formulas SEOs should know appeared first on Search Engine Land.


via Search Engine Land https://ift.tt/YqJFIkV

Forecasting web traffic using Google Analytics and Facebook Prophet

Ready to learn a quick-and-easy way to get traffic predictions for any amount of time in the future?

Seriously.

This article will show you how you can:

  • Predict traffic changes, and maybe even let your boss know when periods of stagnation or negative growth are to be expected.
  • What to expect during times of increased or decreased traffic, so you could tell if your declines are in line with predictions, or if something might be going wrong and traffic is declining more than it should.
  • Include a graph with an update to your boss or client of what’s coming in advance, so they know you aren’t just making excuses after the fact.

Want to skip the info and just click a few buttons? 

While we’ll be going through running the code to forecast your web traffic and what each of the sections does, you can skip this and jump right to the Colab here if you aren’t interested in knowing what’s going on and how to make adjustments.

For those who want to run the code locally and be able to edit the hyperparameters (a fancy name for some of the variables that do important things and generally have one value for a complete run of a model) let’s go!

Important note before you begin: The further ahead you ask it to predict, the wider the gap between the low and high estimates gets as the model becomes “less sure of itself.”

How to forecast your Google Analytics traffic

We’ll be using two systems to accomplish our goal:

  1. UA Query Explorer: In this example, we’re going to use Universal Analytics for our forecasting. I will adjust the code in the Colab in about a year to GA4, but because it needs a year or more of data to really do the job, using UA, for now, makes the most sense and few people have GA4 data going back more than a year. UA Explorer is a tool that will quickly and easily generate the API URL that will pull our analytics for us.
  2. Facebook Prophet: Prophet is a forecasting model built and open-sourced by Facebook. It includes a lot of great built-in features, such as the ability to import holidays. It’s what’ll turn our analytics data into a forecast.

For those who wish to run locally, you can obviously do so, and the code provided will get the job done.

So, let’s dive in and get you predicting your future traffic!

1. Connect your instance

What this means is you’re “turning on” Google Colab so you can run scripts from it.

2. Import the needed libraries

The next thing we need to do is to import the libraries we need to make all this work. 

They are:

  • pandas – a Python library for data manipulation (to help us work with time-series data structures).
  • numpy – needed to work with arrays (like our data and sessions array).
  • matplotlib – we’ll be using this to create some visualizations.
  • json – used to work with JSON data.
  • requests – used to make HTTP requests (like pulling analytics data).
  • fbprophet – used for time series forecasting.
  • pystan – used to update probabilities. Like the probability of the traffic being X on a date in the future.

To run is all you need to do is click the play button.

You’ll see a bunch of downloads start and the play button turn into a spinning icon indicating it’s working, and when they’re done downloading and installing the play button with re-appear.

3. Sign up for Google Analytics demos & tools

You need to log in using the Google account tied to the analytics you want to access.

4. Configure the analytics you’re pulling

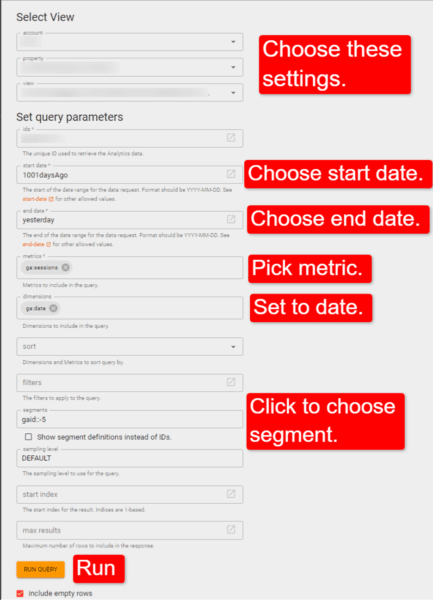
Next you need to select the account, property and view you want to pull your traffic data from.

Where it notes to pick a metric, you can pick from many of your traffic metrics depending on what you want to know. Examples might be:

  • Sessions (the one I use most)
  • Visitors
  • Unique visitors
  • Pageviews

Additionally, when you click the “segments” field a list of all the segments for the property (including custom segments) will display so you can select what traffic you want to look at.

After you’ve run the query just copy the API request URL:

5. Import analytics into the colab

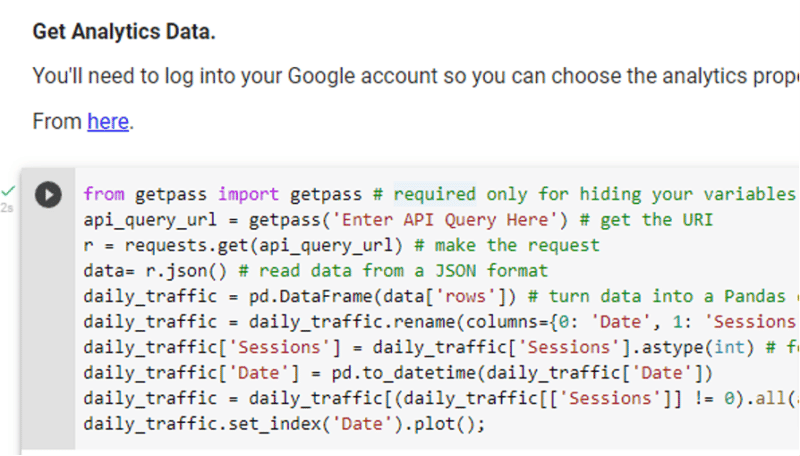
Click the play button in the next cell:

You will be asked to enter the API query you just copied:

Paste it in and hit “Enter.”

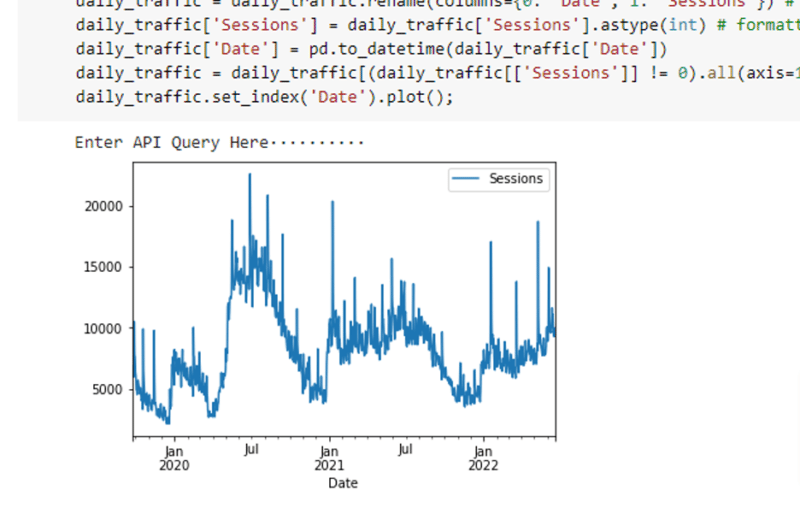
You should be presented with a graph of the traffic over the data range you selected:

6. Formatting

The next cell just changes the column headings to what Facebook Prophet expects.

7. (Optional) Save

This step is completely unnecessary if you don’t plan on referencing back to the traffic numbers or forecasted numbers. I personally find it handy, but some won’t. 

The first thing you’ll track is simply the traffic numbers (same as you could export).

I promise it gets more interesting.

8. Adding holidays

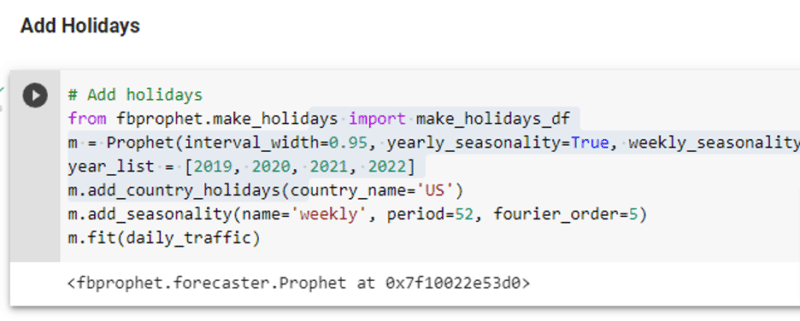
The next step is to add holidays and to determine how seasonality is considered. There are some options and ways you can tweak things, or you can run it as is.

The decisions you need to make are:

  • What years do you want to pull the holidays for?
  • What country do you want to pull the holidays for?

Additionally, you’ll notice the line:

m = Prophet(interval_width=0.95, yearly_seasonality=True, weekly_seasonality=True, daily_seasonality=False, seasonality_mode = "additive", changepoint_range = 0.85)

You can change any of the parameters to suit your needs, though these settings should work decently in most scenario:

  • interval_width: This is how uncertain we’re willing to let the model be. Set to 0.95 it means that when training, 95% of all points must fit within the model. Set it too low, and it follows general trends but isn’t overly accurate. Set too high and it chases too many outliers and becomes inaccurate in that direction.
  • yearly_seasonality: Monitors and responds to yearly trends.
  • weekly_seasonality: Monitors and responds to weekly trends.
  • daily_seasonality: Monitors and responds to daily trends.
  • seasonality_mode: Set to either “additive” or “multiplicative”. Additive (the default) results in the magnitude of change being constant. You’d use this in most case to deal with things like holiday traffic spikes where the percentage increase vs pre-Black Friday is more-or-less steady. Multiplicative is used in scenario where there are growing surges. For example, in a growing town that sees an additional increase each year. Not only is there growth, but that growth gets larger with each interval.
  • changepoint_range: A change point are points where the traffic changes significantly. By default the changepoint 

This is a tip-of-the-iceberg scenario. There are other parameters you can review and apply as you feel so inspired. Details on them are available here.

I’ve set things here to what seems to work well for me in most (but not all cases). 

Yearly and monthly seasonality impact most businesses. Daily, not so much.

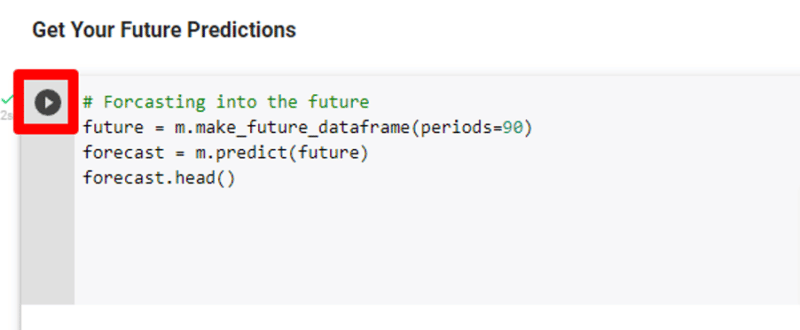
9. Crunch the numbers

Thankfully you don’t have to do it. 

Simply click the run button.

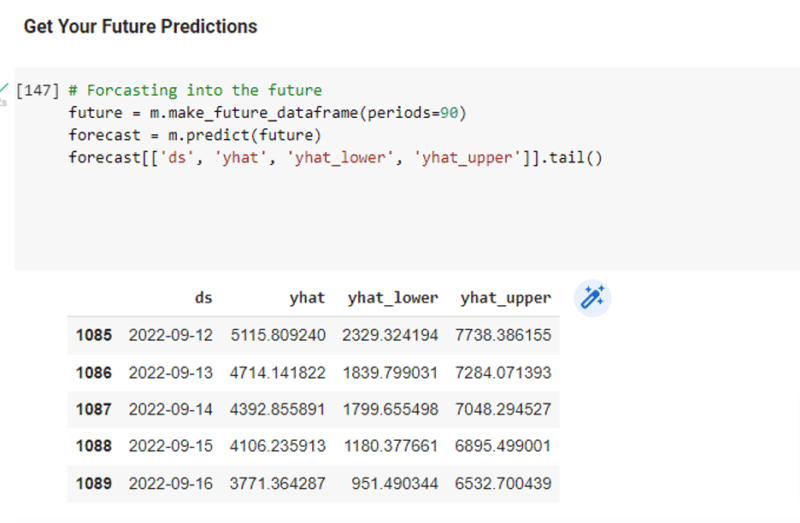
And you’ll soon see:

Not all the rows or columns are showing. If they were, what you’d see is:

  • The highest number the model predicts likely (yhat_upper).
  • The lowest (yhat_lower).
  • The predicted value (yhat).

Importantly, you’ll see “periods=90” in the code above. That is the number of days I’m going to get predictions for.

I’ve found 90 works decently. After that, the range gets pretty large between high and low but can be interesting to look at.

10. (Optional) Save predictions

This is an optional step for those who would like to save their predicted values, or use them to test against different parameter values (those discussed in step eight above).

Once run, you’ll just click the link:

Which takes you to:

Each time you run it your numbers and results will be stored and can be easily accessed at a future time to compare with different runs.

It will also give you the numbers to reference if you’re ever asked for a predicted value for a specific day.

11. The magic

Hit the run bottom and you get what you’ve likely come here to get.

Optional

I’ve added an extra Insights section. It simply displays the impact of some of the areas we’ve been discussing above.

You can see in the top chart, where the different change points are. Further down you get insights into how the different seasonal trends are impacting the predictions, etc.

Closing

I’ve always looked for ways to predict in advance what’s coming my way.

It’s always better to show your boss or client that a slowdown is expected a week before it happens rather than try to explain it after the fact. 

Additionally, this insight can also help you plan your strategy.

Your work may be different when in your peak traffic points, than it is when you’re in a lull. You can look back over your analytics trends month-by-month, year-by-year and try to piece it together – or just let machines do what machines do best.

Just a reminder, if you got to the bottom and wanted to get to the Colab to run this yourself, you’ll find it here.

The post Forecasting web traffic using Google Analytics and Facebook Prophet appeared first on Search Engine Land.


via Search Engine Land https://ift.tt/EI3eHS1

3 ways to dominate with Google Auction Insights and search intelligence

While marketers have overcome many challenges in recent years, sadly, the second half of 2022 is poised to be very different from the first. Unprecedented macroeconomic factors such as high inflation, food and energy costs and the war in Ukraine are impacting our business.

Hiring is starting to slow down, and the pressure is on. There is a good chance that you’ll probably be asked to do more with less, as budgets may be prioritized and cut in certain areas. 

On the flip side, Google Search ad spend continues to rise. It’s the channel that is always on, the channel with the highest conversion rate and the channel that won’t go away.

This part of the marketing mix is reliable and constant, but are the campaigns delivering success? Are they contributing to sales? Contributing to leads?

Auction Insights is a powerful tool we’ve all come to use for understanding campaign performance against competitors. Search intelligence adds another layer of granularity to ensure you’re one step ahead of your competition.  

Join Ashley Fletcher, VP of Marketing at Adthena, in his informative SMX Advanced session to explore three easy search intelligence tactics that will help you dominate your competitive landscape. He also shares use-cases from L’Oreal and Avanti West Coast trains.  

After this session, you’ll be able to save time with competitive monitoring, track performance over time and see your competitor’s spend and ad copy. The presentation will help you use data to make better ad campaign decisions and dig into search intelligence to understand why certain ads are successful to ultimately dominate the competition.

The post 3 ways to dominate with Google Auction Insights and search intelligence appeared first on Search Engine Land.


via Search Engine Land https://ift.tt/BfcoLJQ

Wednesday, 29 June 2022

Warby Parker dodges 1-800 Contacts lawsuit over search results, website

A lawsuit filed by 1-800 Contacts against online retailer Warby Parker has been dismissed by a federal judge.

At issue was Warby Parker’s use of 1-800 Contacts’ branded keywords to redirect searchers to the Warby Parker online store, thereby “confusing” potential customers.

The decision. Kevin Castel, senior judge of the U.S. District Court for the Southern District of New York, ruled against 1-800 Contacts, saying that customers are unlikely to think that they’re buying from 1-800 Contacts when they click on a Warby Parker ad.

Castel also said the companies’ trademarks were too dissimilar to confuse contact-lens buyers, who are likely to pay close attention to what they are purchasing and noted that Warby Parker’s name is clearly displayed in the search results and on its website.

Castel added that prospective customers will take the time to figure out that the search results link to Warby Parker’s website, and will therefore discern that they are buying from contacts from Warby Parker’s website. 

In my own Google search, I was unable to mimic the results that this suit was based on and didn’t find any Warby Parker ads initially.

1-800 Contacts response. A spokesperson for 1-800 Contacts said after the ruling that the decision by the judge was “inconsistent with several well-established legal principles,” and that the company is “evaluating appropriate next steps, including whether to appeal.”

You can read more about the ruling from Reuters here.

Sounds familiar. Competitive keyword advertising lawsuits rarely turn out well for the trademark owners in court. Earlier this year we reported on an attempt by Edible Arrangements to sue Google over theft, conversion and racketeering. Edible Arrangements lost.  

Why we care. This is the latest reminder that, in general, using a competitor’s trademarks in PPC ads is not trademark infringement from a legal standpoint. You can visit the Google trademark help document if you find yourself facing a similar issue. Still, tread carefully if you use another brand’s keywords in your ad strategy if you want to steer clear of fighting lawsuits.

The post Warby Parker dodges 1-800 Contacts lawsuit over search results, website appeared first on Search Engine Land.


via Search Engine Land https://ift.tt/albzXgc

FCC wants Apple and Google to remove TikTok

US Federal Communications Commissioner Brendan Carr is requesting that Apple and Google ban TikTok from their app stores. The request is due to the social media apps “pattern of surreptitious data practices.”

The request comes after BuzzFeed News reported that US data had been accessed from China. TikTok had been adamant for years that any data access from US users had been kept in the US. But according to leaked audio, employees of TikTok have been able to access nonpublic data about TikTok users.

“As you know TikTok is an app that is available to millions of Americans through your app stores, and it collects vast troves of sensitive data about those US users. TikTok is owned by Beijing-based ByteDance — an organization that is beholden to the Communist Party of China and required by the Chinese law to comply with PRC’s surveillance demands,” Carr said in a letter addressed to Sundar Pichai and Tim Cook.

“It is clear that TikTok poses an unacceptable national security risk due to its extensive data harvesting being combined with Beijing’s apparently unchecked access to that sensitive data.”

TikTok’s response. After the revelations, TikTok was quick to respond that it was moving all US users’ data to Oracle servers. They add that they expect to delete all US user data from their own centers. 

This sounds familiar. In 2020 then President Donald Trump signed an executive order banning TikTok from the US, citing an investigation in 2019 over national security concerns. TikTok responded saying that the EO was issued without any due process. Last year, President Biden revoked the ban and replaced the order with requirements that the Commerce Department review apps that may pose national security risks. 

TikTok, Apple, and Google have not yet responded to the request. 

Why we care. Apparently, only the US can access US user data. In all seriousness, the calls for a ban seem to be hypocritical at best. While we understand the need to limit national security threats from foreign adversaries, where do we draw the line? Will all foreign apps be required to keep their US data in the country? 

Businesses that use TikTok advertising should also take note and plan for changes in the near future.

The post FCC wants Apple and Google to remove TikTok appeared first on Search Engine Land.


via Search Engine Land https://ift.tt/y2KvbmU

Google Maps adds new store location feature, Locator Plus, Reserve with Google integration, new analytics and more

The Google Maps Platform has added a bunch of new features for businesses to add deeper integration with its Google Maps Platform APIs to help those businesses streamline some of their integrations with Google Maps. These include the ability to embed Reserve with Google on your site, a new embed a store location tool, a Locator Plus feature, store locator analytics and more.

Reserve With Google Embed Feature

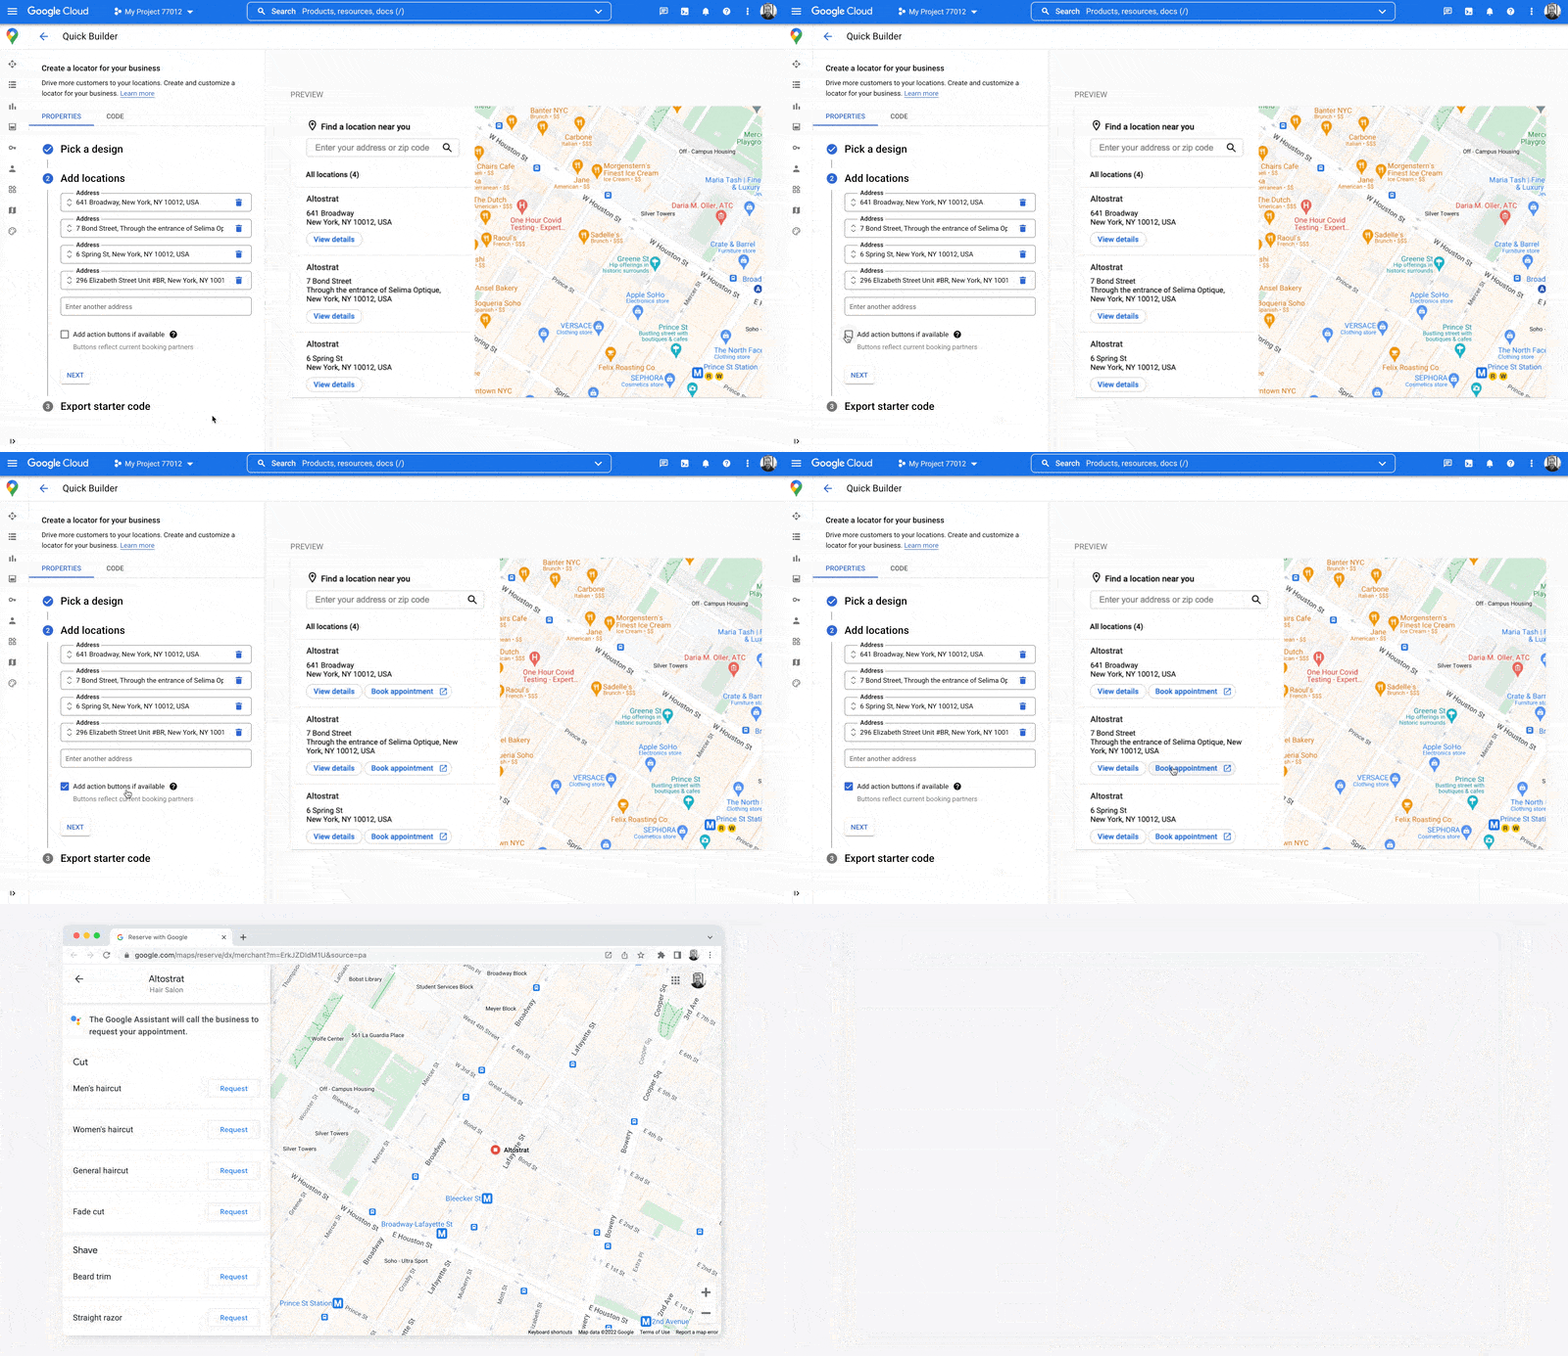
We have seen Reserve with Google feature in Google Search and Google Maps for a while now. Now, Google is allowing businesses to use the Reserve with Google feature on their own sites or portals.

Google added new APIs to allow you to embed the Reserve with Google on your site and your own maps. Google said this allows for “end-to-end appointment booking flow, and connects users to a variety of services.” It allows your customers who are using your store locator an option for bookings, right within the locator, which creates an easier booking process.

Here is how it works:

Store Locator Embed Feature

Google also has rolled out a way to manage and publish your store locator using the Google Maps platform. Google said this will allow you to “quickly update and roll out your store locator” on your site. In the Locator Plus solution, you can capture the location of every single store you want to show users – all within one map, Google explained. This can now be done with a simple copy and paste of some embed code and very little API development coding.

Google Locator Plus

Similar to the store locator feature, the new Locator Plus feature allows businesses to easily import business details from your Google Business Profile. This will allow the business details your already have in your Google Business Profile to be reflected in the store locator on your website. The details include include hours, contact information, photos, service options, and more.

Google Store Locator Analytics

With all these announcements, Google also is rolling out a new Google store locator analytics dashboard. This analytics dashboard should help you better understand the impact of your implementation and generate insights from your data. It shows you how well your site visitors are engaging with your store locator, Google said.

The dashboard helps you measure your performance week over week, including number of views, number of interactions with Google Search and Google Place Details, and overall engagement rate. The dashboard uses anonymized data to provide important benchmarks on how a developer’s implementation compares against other developers using the same solution.

Why we care. All these tools can be useful for large and small businesses to manage their local presence not just on Google but also on their own site. Plus, searchers are accustomed to Google and may find these embed features familiar and be more likely to use them.

At the same time, this is putting more and more of your data in Google, making you more reliant on Google for management and hosting of this features and data. So keep that in mind before implementing these on your site.

The post Google Maps adds new store location feature, Locator Plus, Reserve with Google integration, new analytics and more appeared first on Search Engine Land.


via Search Engine Land https://ift.tt/6dH1BQX

What are Identical Keywords and why they matter for Google Ads

While Google’s newest campaign type, Performance Max (PMax), is devoid of keyword data,  some new information may help advertisers better steer their efforts with the product.

PMax campaigns are unique to all other campaign types as no keywords are required and no keyword data is delivered to advertisers. The closest existing campaign type is the fully automated shopping-only product, “Smart Shopping” which will be shuttered in July.

The big difference between the two is that Performance Max campaigns can run without a product feed and can also include local ad elements. 

Those PMax campaigns without a feed or local inputs can gain inventory on Google search by simply inputting a website or pages into the campaign. Due to the fully automated nature of the campaign, Google will then choose keywords to show on Google Search as well as other placements on Gmail/YouTube/Display/Discover

Many advertisers rightfully want to know what this means for their existing search campaigns, many of which have had keywords painstakingly pruned for optimal performance.

Google has stated multiple times that Performance Max campaigns on Google Search will not take traffic away from existing eligible keywords that are “identical” to a user’s query.

If you have a keyword in your campaign in any format (broad, phrase or exact match) that identically matches the user’s query and is eligible (has a high enough quality score/bid/budget/AdRank to show) then the existing campaign will trump Performance Max campaigns.

However, many advertisers aren’t buying it.

Google: PMax won’t cannibalize existing campaigns

At a recent Friends of Search event, Rodney Ip, Global Product Lead, Google Ads, Google, stated that “when you see brand traffic in PMax it’s not cannibalization, it’s likely that your standard brand campaign is capped or maxed out and PMax is stepping in to deliver more brand traffic.” according to Mike Ryan of Smarter Ecommerce:

The responses to that statement painted a much different picture.

Most of the advertisers strongly disagreed with the statement and a healthy dialog ensued. A comment from Colin Slattery brought up competing data points to Ip’s statement.

This should not be the case if users have the corresponding “identical keyword” in a search campaign, according to Google Ads Product Liaison Ginny Marvin:

What exactly are ‘identically matching’ terms?

So what is an “identical keyword”? Marvin gave a surprising answer: 

“Identical means the keyword is the exact same or spell-corrected. When there is not an exact match to the user query, prioritization is based on Ad Rank to determine which campaign is predicted to deliver the most relevant ad & best ROI.”

Recapping, an identical keyword is now defined as:

  1. Independent of match type (broad/phrase/exact).
  2. Is a term where the search query is the “exact-same” as keyword existing within an advertiser’s campaign.
  3. Spell-corrected keywords/search terms.

In order to keep the wide reach of a Performance Max campaign from cannibalizing other campaigns, one simply needs to ensure that they have the desired “identical keyword” in their campaigns (in and match type) as long as it is eligible to serve.

Does this fundamentally go against Google’s best practices?

For years now, paid search advertisers have moved away from a massive number of iterations of search queries as matching has gotten looser (and smarter) in Google Ads.

Close variants and smarter machine learning has allowed advertisers to have greater success using fewer keywords (in most cases). 

With the need to now have an “identical keyword” in a campaign, the astute question arose: Do these recommendations of ensuring all identical keywords are in an account go against what Google has been preaching for years now?

In order to keep PMax from stealing traffic from other campaigns, said campaigns should now protect their reach by building out in-depth lists of all possible identical keywords.

For example, an eligible phrase match search query in a search campaign like “Nike Sneakers” that would normally match to “buy nike sneakers” may now lose that traffic to a Performance Max campaign as the keyword is not “identical” to the query.

In order to be protected from PMax stealing that traffic, Nike would need to include the term “buy nike sneakers” in their campaigns in order to have an identical keyword.

What this means for you

We know that an exact match keyword doesn’t match to a query exactly.

We now know that an ”identical keyword” is a “match-type less” keyword that must exactly match the user query or be a keyword that shows a misspelling.

Honestly, this is quite confusing to explain to clients or other departments. But it is quite necessary if running PMax campaigns. 

If you are testing out PMax campaigns, in order to protect your other campaigns, you may now find yourself circa 2010 working on adding as many possible iterations and variations to build out “identical keywords” in your search accounts.

With PMax not providing any keyword data to advertisers, this effort may be a painstaking – but fruitful. 

If you have a good Google Ads rep, they may be able to put negative keywords into a Performance Max campaign for you to help guide the system in a different format.

However, this feature isn’t built into campaigns for advertisers. You need a special exception.

The post What are Identical Keywords and why they matter for Google Ads appeared first on Search Engine Land.


via Search Engine Land https://ift.tt/CGoasvy

How to empower your SEO and digital marketing strategy with data

After your technical, content and outreach strategies are in place, you should be well on your way to digital marketing success. 

At this stage, you should have optimized your website for a strong page experience, created lots of entity-driven content, and gained inbound links providing you with rankings and traffic.

Now, you’ll need to empower your team with the right data to help you continue to grow and shape your digital marketing strategy.

Setting up your dashboards

Fortunately, a myriad of tools can help organize the data you need to keep your traffic growing.

Here are some data points you can look at:

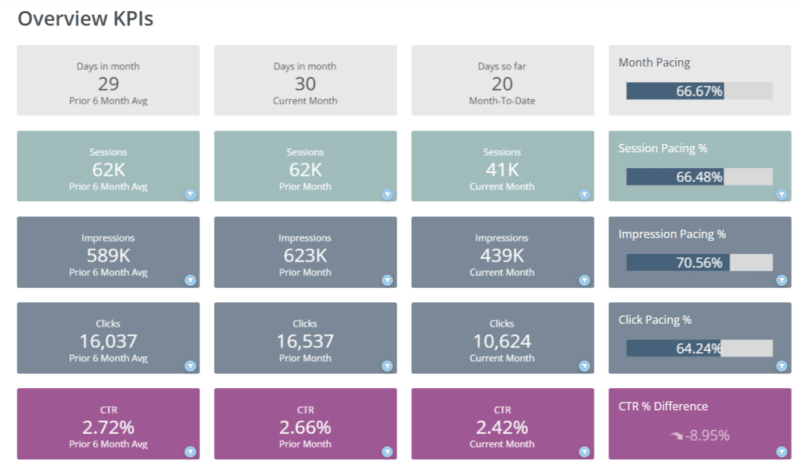
  • Overall KPIs: Are your site’s sessions, impressions, clicks and conversions trending up or down?
  • Keywords ranking: How many keywords are ranking in the top 1-3, 4-10, 11-20, or in the top 100 of Google? What keywords are gaining or losing traction? What is the estimated traffic cost of these keywords? What keywords are seeing the most volume and conversions?
  • Pages trending up/down: What pages have a high volume of traffic? What pages are losing traffic? These pages can be optimized and expanded to add more optimized content and internal links.
  • Striking distance keywords: What keywords are in the top 20? Once you identify these, consider adding internal and external links to those pages and perform on-page SEO to push those keywords higher in the SERPs.
  • Content optimizations: What content can you add to pages trending up or down? Type the target keyword for the page, and use questions from Google’s People Also Ask box to enhance your content.
  • Audience demographics: Google Analytics includes a plethora of audience reports, including age, gender, interests, geographical targeting, devices and more. Use this data to build your persona profiles and target keywords for each persona and buying stage.
  • Attribution: This reflects the buyer’s journey. Understanding where consumers come from, what pages they visit, and where they go after leaving your site can help you improve the user experience.

Optimization experiments

It’s important to look at your data and develop actionable plans based on your findings.

Some ways to use your data:

  • Optimize articles trending down by doing better on-page SEO or adding more semantically related content.
  • Build internal and external links to pages and/or keywords that are trending up or down.
  • Write more content for a specific target persona and buying stage.
  • Focus your efforts on channels and partnerships that are yielding traffic and referrals.

Every time you update a page, create new content or add links, you should create an annotation to determine if the changes made resulted in positive growth.   

If you continue producing content and building links without checking your analytics and data, you may waste valuable time and resources.


Get the daily newsletter search marketers rely on.

Processing...Please wait.


Conversion rate optimization (CRO)

Now you have all this wonderful traffic coming to you, how do you improve your conversion rate and turn more visitors into customers?

The ideal way is to do A/B testing and conversion rate optimization. 

You’ll need to set up software that will give users two variants of your site. You can then track to see which cohort had better conversions.

Various tools will help you conduct this research:

  • FigPii
  • Heap.io
  • Hotjar
  • VWO

Ensure you continuously run tests and update your landing pages and articles. If users have a good experience on your site, this will have a positive impact on your SEO.

Just when you feel you have a grasp on your strategy, Google releases an algorithm update that creates upheaval in your traffic and rankings.

Monitoring trends will help you stay compliant and within Google’s best practice guidelines.

Some trends you can look out for:  

  • Focus on voice and question-based queries. As smart devices advance, such as watches, glasses, and wearables, interactions with the search engine may increasingly occur via voice. You should always be using questions as keywords and optimizing for voice search.
  • Emphasis on quality over quantity. Based on crawl prioritization. Produce fewer pieces of content, but ensure those pieces provide the best possible user experience. Promote your articles to build links as often as you publish so that your link growth velocity is congruent with your content publishing ratio.
  • Optimize for entities, not keywords. As Google’s understanding of natural language processing improves and their machine-learning algorithms become increasingly sophisticated, they can understand pages for meaning, not just keywords. The days of optimizing pages for a single query are over. Instead, we are seeing an emphasis on building pages around topics and including variants of the topic.  
  • Emphasis on user engagement signals, especially speed. Google introduced Core Web Vitals to break down the elements of site load speed, from “How Quickly a Page Loads” to “How quickly do users see the first thing on the page”? How Quickly is the page interactive? How quickly is the page fully functional?
  • Indexing and crawling prioritization. The number of pages indexed grows exponentially and Google is moving away from indexing everything, to indexing quality content. They are prioritizing crawls to pages that are trusted and authoritative.
  • Link building. Following their overall shift towards authority, it’ll become increasingly important to receive mentions from media and trusted sources. If your friends all say you’re the best chef, everyone knows this can be biased. However, if people that don’t know you say you’re the best chef, this has more weight and value. Focus especially on gaining authoritative links that your competitors don’t already have. 

Tracking your site’s metrics, KPIs and trends in search will help you continuously revamp and update your SEO strategy.

It’s the only way to stay relevant and current.

Make sure you build dashboards that allow you to check the performance of your campaigns and react quickly to changes in your site’s performance.

The post How to empower your SEO and digital marketing strategy with data appeared first on Search Engine Land.


via Search Engine Land https://ift.tt/pOgckl2